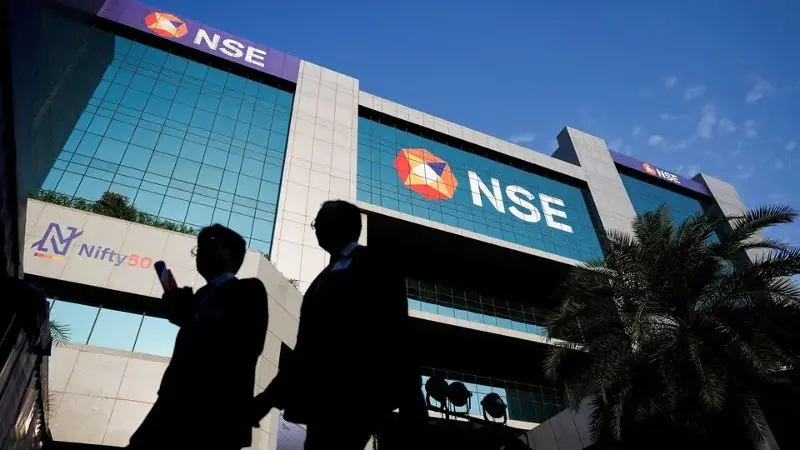
The Indian stock market has staged a sharp recovery in recent months following a period of heightened volatility. Both the Nifty 50 and Sensex have risen nearly 17% from April lows, and are now trading close to their September peaks, gaining around 8% year-to-date (YTD). The benchmark indices have closed each of the last four months in the green. This stellar rebound has lifted India’s share in global market capitalisation to 4%, up from a 16-month low recorded in February 2025.
The rally has been led by domestic cyclicals, supported by multiple macro tailwinds, including ongoing trade talks with the US, RBI rate cuts, strong government capex, above-average monsoons, lower commodity prices, and ample banking system liquidity, contributing to an improved macroeconomic outlook and renewed optimism in the equity markets.
Along with the continued support from domestic investors, overseas investors have also joined hands and pumped money over the last three months, which pushed the majority of stocks to see their recent highs, and some even recorded fresh all-time highs. DIIs alone have injected over ₹3.5 lakh crore in the first 6 months, which was the highest ever half-yearly inflow.
28 Nifty 50 stocks are trading above their historical averages
According to the latest analysis done by the domestic brokerage firm Motilal Oswal, 28 constituents of the Nifty 50 index are trading above their 10-year averages, with Bharat Electronics stock trading with a steep premium to its historical valuation, with a current P/E of 47.9x, 263% higher than its 10-year average of 13.2x.
It is followed by Mahindra & Mahindra, with the PE at 35x, which is an 85% premium to its historical average of 18.9x. Other auto names like Bajaj Auto (+69%), Eicher Motors (+37%), and Hero MotoCorp (+26%) are also commanding significant premiums.
In the technology space, HCL Technologies, Tech Mahindra, and Infosys are trading at 43%, 42%, and 12% premiums, respectively, while Reliance Industries is trading at a PE of 24.5x, which is 35% higher than its 10-year average of 18.2x. Other notable names trading above their long-term averages include Titan Company, Trent, Larsen & Toubro, and Wipro, with premiums ranging from 12% to 21%.
In contrast, some stocks are trading at a discount to their long-term averages. Asian Paints is trading at an 18% discount, while HUL is at a 12% discount, suggesting pockets of underperformance or valuation correction in defensives.
Among financials, Axis Bank is trading at a sharp 67% discount to its 10-year average PE, followed by Kotak Mahindra Bank (-25%) and IndusInd Bank (-14%). With over half of its constituents trading above their long-term averages, the Nifty 50 is now valued at a 5% premium to its 10-year average P/E of 20.7x.
Infrastructure, utilities, and capital goods trade at the highest valuation premiums
In terms of sector valuations, the brokerage report shows that 13 out of 20 sectors it tracks are trading at a premium to their historical averages, with infrastructure emerging as the most heated sector as it is currently trading at a 51.2% premium to its 10-year average P/E of 12.7x, followed by utilities at a 41.4% premium and capital goods at 43.9%, reflecting strong investor preference for core economy and policy-driven sectors.
Other sectors trading significantly above their historical averages include chemicals (39.6%), cement (34.5%), and consumer durables (30.6%), all driven by demand recovery and earnings growth visibility.
On the other hand, media is trading at the steepest discount of -33.7%, followed by PSU banks at -27.8% and private banks at -14.4%, indicating investor caution in rate-sensitive or cyclical names.
The auto sector, often considered a proxy for consumption, is also trading at an 11.6% discount to its 10-year average, which is impacted by the steady drop in auto sales in recent quarters. Meanwhile, retail, consumer ex-ITC, and metals are hovering close to their historical averages with mild discounts, as per the Motilal Oswal.
Disclaimer: The views and recommendations given in this article are those of individual analysts. These do not represent the views of Mint. We advise investors to check with certified experts before taking any investment decisions.
